
目次
はじめに
ロボティクスにおいて、
データをいくつかのグループに分類する
クラスタリングは重要な技術です。
例えば、移動物体の位置と速度などを
レーザセンサやステレオカメラを使ってトラッキングしたい場合、
センサの観測値データをクラスタリングし、
移動物体から検出された観測点のみを抽出したくなります。
今回、クラスタリングのアルゴリズムの中でも最も基礎的な
k-meansアルゴリズムを使ってクラスタリングを実施する
MATLABとPythoのサンプルプログラムを作ってみました。
k-meansアルゴリズムについて
k-meansアルゴリズムは、
各クラスタの平均値を使って、k個のクラスタに分けることから、
k-meansアルゴリズムと呼ばれているようです。
クラスタリングの方法としては
下記の順番で各データをラベリングします。
すべてのデータをランダムにラベリングする
それぞれのラベル(クラスタ)の平均値を計算する
各クラスタの平均値と各データの距離を使って一番近いクラスタにラベルを更新する
各データのラベルが変わらなくなるまで、2-3を繰り返す。
です。
非常にシンプルですが、
冒頭の図のように、ちゃんとクラスタリングしてくれます。
k-means法ではクラスタの数は
事前に決定し、パラメータとして与えておく必要があります。
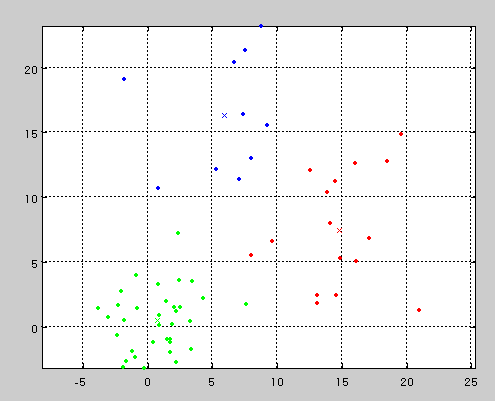
下記の図のように、2つのソースから生成されたデータにおいても、
クラスタ数を3とすることで、無理やり3つのクラスタに分けることもできます。
k-means法の詳細に関しては、
下記の資料を参照ください。


MATLABサンプルプログラム
下記のGitHubのリポジトリにも置いてあります。
MATLABRobotics/kmeansSample.m at master · AtsushiSakai/MATLABRobotics
% -------------------------------------------------------------------------
%
% File : kmeansSample.m
%
% Discription : Sample code for k-means clustering
%
% Environment : Matlab
%
% Author : Atsushi Sakai
%
% Copyright (c): 2015 Atsushi Sakai
%
% License : GPL Software License Agreement
% -------------------------------------------------------------------------

function kmeansSample()
close all;
clear all;

disp('k-means clustering sample start!!');

data=GetRawData();%生データを取得する関数

%k-means法によるクラスタリング
nCluster=2;%クラスタの数
[result,means]=kmeansClustering(data,nCluster);
%クラスタリングの結果を表示
ShowClusteringResult(result,means,nCluster);

function [result,means]=kmeansClustering(data,nCluster)
%k-meansを使ってクラスタリングを実施する方法

%初期クラスタリング ランダムにクラスを振り分ける
result=[data randi(nCluster,[length(data(:,1)),1])];

while 1
    means=[];
    for i=1:nCluster
        %各クラスタの平均値を計算
        means=[means;mean(result(result(:,3)==i,1:2))];
    end

    %クラスタリングの結果を表示
    ShowClusteringResult(result,means,nCluster);

    %各データを平均値から近い順に再クラスタリング
    nUpdate=0;%クラスタが更新された数
    for j=1:length(result(:,1))

        %各データと各平均値までの距離を計算
        d=[];
        for k=1:nCluster
            d=[d norm(result(j,1:2)-means(k,:))];
        end
        [c,i]=min(d);%一番距離の小さいクラスタのIDを計算
        if result(j,3)~=i
            result(j,3)=i;%クラスタを更新
            nUpdate=nUpdate+1;
        end
    end

    if nUpdate==0
        break;%クラスタが変化しなくなったら終了
    end

    pause;
end

function ShowClusteringResult(result,means,nCluster)
%クラスタリングの結果をグラフに描画する関数
hold off;

%グラフの色用のデータを作成
cc=hsv(nCluster);

%各クラスタ毎にデータを描画
for i=1:nCluster
    data=result(result(:,3)==i,1:2);
    plot(data(:,1),data(:,2),'.','Color',cc(i,:)); hold all;
    plot(means(i,1),means(i,2),'x','Color',cc(i,:));hold all;
end
axis equal;
grid on;
hold on;


function data=GetRawData()
%擬似データのクラスターの中心と誤差量
nSample=[0 0 2;
        10 10 5];
ndata=30;%一つのクラスタに関するデータ点
data=[];

for nc=1:length(nSample(:,1))
    for i=1:ndata
        xy=nSample(nc,1:2)+randn(1,2)*nSample(nc,3);
        data=[data;xy];
    end
end
data=sortrows(data,2);%データをソートして混ぜる
Pythonサンプルコード
下記がkmeans法のPythonサンプルコードです。
"""
Object clustering with k-means algorithm
author: Atsushi Sakai (@Atsushi_twi)
"""

import numpy as np
import math
import matplotlib.pyplot as plt
import random

show_animation = True


class Clusters:

    def __init__(self, x, y, nlabel):
        self.x = x
        self.y = y
        self.ndata = len(self.x)
        self.nlabel = nlabel
        self.labels = [random.randint(0, nlabel - 1)
                       for _ in range(self.ndata)]
        self.cx = [0.0 for _ in range(nlabel)]
        self.cy = [0.0 for _ in range(nlabel)]


def kmeans_clustering(rx, ry, nc):

    clusters = Clusters(rx, ry, nc)
    clusters = calc_centroid(clusters)

    MAX_LOOP = 10
    DCOST_TH = 0.1
    pcost = 100.0
    for loop in range(MAX_LOOP):
        #  print("Loop:", loop)
        clusters, cost = update_clusters(clusters)
        clusters = calc_centroid(clusters)

        dcost = abs(cost - pcost)
        if dcost < DCOST_TH:
            break
        pcost = cost

    return clusters


def calc_centroid(clusters):

    for ic in range(clusters.nlabel):
        x, y = calc_labeled_points(ic, clusters)
        ndata = len(x)
        clusters.cx[ic] = sum(x) / ndata
        clusters.cy[ic] = sum(y) / ndata

    return clusters


def update_clusters(clusters):
    cost = 0.0

    for ip in range(clusters.ndata):
        px = clusters.x[ip]
        py = clusters.y[ip]

        dx = [icx - px for icx in clusters.cx]
        dy = [icy - py for icy in clusters.cy]

        dlist = [math.sqrt(idx**2 + idy**2) for (idx, idy) in zip(dx, dy)]
        mind = min(dlist)
        min_id = dlist.index(mind)
        clusters.labels[ip] = min_id
        cost += min_id

    return clusters, cost


def calc_labeled_points(ic, clusters):

    inds = np.array([i for i in range(clusters.ndata)
                     if clusters.labels[i] == ic])
    tx = np.array(clusters.x)
    ty = np.array(clusters.y)

    x = tx[inds]
    y = ty[inds]

    return x, y


def calc_raw_data(cx, cy, npoints, rand_d):

    rx, ry = [], []

    for (icx, icy) in zip(cx, cy):
        for _ in range(npoints):
            rx.append(icx + rand_d * (random.random() - 0.5))
            ry.append(icy + rand_d * (random.random() - 0.5))

    return rx, ry


def update_positions(cx, cy):

    DX1 = 0.4
    DY1 = 0.5

    cx[0] += DX1
    cy[0] += DY1

    DX2 = -0.3
    DY2 = -0.5

    cx[1] += DX2
    cy[1] += DY2

    return cx, cy


def calc_association(cx, cy, clusters):

    inds = []

    for ic in range(len(cx)):
        tcx = cx[ic]
        tcy = cy[ic]

        dx = [icx - tcx for icx in clusters.cx]
        dy = [icy - tcy for icy in clusters.cy]

        dlist = [math.sqrt(idx**2 + idy**2) for (idx, idy) in zip(dx, dy)]
        min_id = dlist.index(min(dlist))
        inds.append(min_id)

    return inds


def main():
    print(__file__ + " start!!")

    cx = [0.0, 8.0]
    cy = [0.0, 8.0]
    npoints = 10
    rand_d = 3.0
    ncluster = 2
    sim_time = 15.0
    dt = 1.0
    time = 0.0

    while time <= sim_time:
        print("Time:", time)
        time += dt

        # simulate objects
        cx, cy = update_positions(cx, cy)
        rx, ry = calc_raw_data(cx, cy, npoints, rand_d)

        clusters = kmeans_clustering(rx, ry, ncluster)

        # for animation
        if show_animation:
            plt.cla()
            inds = calc_association(cx, cy, clusters)
            for ic in inds:
                x, y = calc_labeled_points(ic, clusters)
                plt.plot(x, y, "x")
            plt.plot(cx, cy, "o")
            plt.xlim(-2.0, 10.0)
            plt.ylim(-2.0, 10.0)
            plt.pause(dt)

    print("Done")


if __name__ == '__main__':
    main()
下記のリポジトリでも、
上記のサンプルコードを公開しています。
上記のコードを実行すると、
下記のようなk-means法による
物体クラスタリングのシミュレーションが実施されます。
Juliaサンプルコード
下記がkmeans法のJuliaサンプルコードです。
#
# kmeans clustering simulaton
#
# author: Atsushi Sakai
#

using PyPlot

function kmeans(x, k; maxiters = 100, tol = 1e-5)

    N = length(x)
    n = length(x[1])
    distances = zeros(N) # will be used to store the distance of each

    # point to the nearest representative.
    reps = [zeros(n) for j=1:k] # will be used to store representatives.

    # 'assignment' is an array of N integers between 1 and k.
    # The initial assignment is chosen randomly.
    assignment = [ rand(1:k) for i in 1:N ]

    Jprevious = Inf # used in stopping condition
    for iter = 1:maxiters
        # Representative of cluster j is average of points in cluster j.
        for j = 1:k
            group = [i for i=1:N if assignment[i] == j]
            reps[j] = mean(x[group])
        end

        # For each x[i], find distance to the nearest representative
        # and its group index.
        for i = 1:N
            (distances[i], assignment[i]) = findmin([norm(x[i] - reps[j]) for j = 1:k])
        end

        # Compute clustering objective.
        J = norm(distances)^2 / N

        # Show progress and terminate if J stopped decreasing.
        println("Iteration ", iter, ": Jclust = ", J)
        if iter > 1 && abs(J - Jprevious) < tol * J
            return assignment, reps
        end
        Jprevious = J
    end

    println("Does not finish")
end

function main()
    println(PROGRAM_FILE," start!!")

    # generate input data
    input = vcat( [ 0.3*randn(2) for i = 1:100 ],
                [ [1,1] + 0.3*randn(2) for i = 1:100 ],
                [ [1,-1] + 0.3*randn(2) for i = 1:100 ] )

    # k-means clustering
    ncluster = 3
    assignment, reps = kmeans(input, ncluster)

    # raw data
    plot([i[1] for i in input],[i[2] for i in input],"xk")

    # clustering result
    plot([i[1] for i in input[assignment.==1]],[i[2] for i in input[assignment.==1]],".r")
    plot([i[1] for i in input[assignment.==2]],[i[2] for i in input[assignment.==2]],".g")
    plot([i[1] for i in input[assignment.==3]],[i[2] for i in input[assignment.==3]],".b")

    # center of cluster
    for i in 1:ncluster
        plot(reps[i][1], reps[i][2], "oc")
    end

    axis("equal")
    show()

    println(PROGRAM_FILE," Done!!")

end

main()
上記のコードを実行すると、
下記のようなkmeansのクラスタリングの結果が表示されます。

参考資料
[#02 位置と集団を見抜く / 4. クラスタ生成の統計アルゴリズム | Antecanis] (http://www.antecanis.com/texts/group_04/)
MyEnigma Supporters
もしこの記事が参考になり、
ブログをサポートしたいと思われた方は、
こちらからよろしくお願いします。